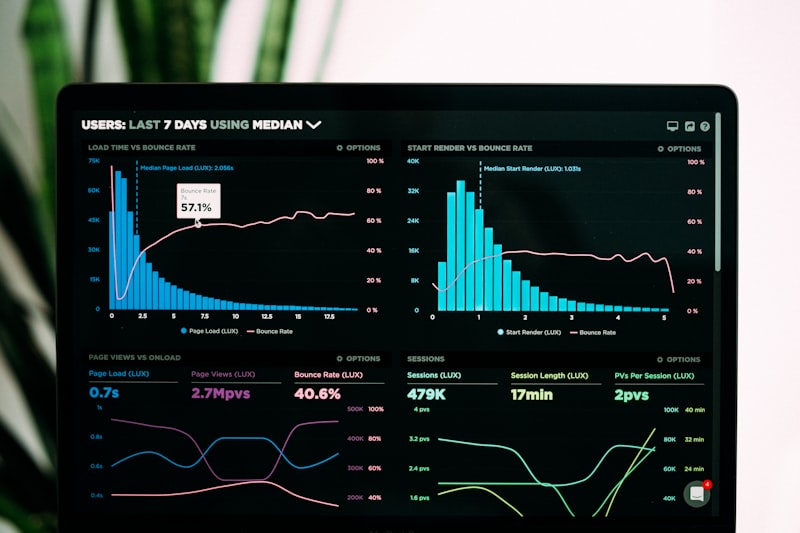
A technical guide to building automated FCR and hen-day production reports: correct formulas, data schema, SQL queries, scheduling, and WhatsApp alerts for layer farms.
Imagine a layer farm with 10,000 chickens in three houses. Every morning the supervisor records feed consumption in a book, in the afternoon warehouse staff recap eggs in a spreadsheet, then at the end of the month administrative staff combine everything to calculate FCR and hen-day production. The results only come out on the 5th of the following month — and even then after two revisions because some cells had wrong references. When this month's FCR rises from 2.18 to 2.34, the manager cannot pinpoint the cause: is feed being wasted, has egg weight dropped, or is the chicken population no longer accurate? The real problem is not the formula, but data that is scattered, manually entered, and never recalculated consistently. Yet FCR and hen-day production are the two most sensitive KPIs in the layer business: a 0.1-point FCR difference on 10,000 chickens can mean tens of millions of rupiah per cycle. This article discusses how to build automatic reports for both, from table schema to daily notifications, with example numbers and code snippets that can be run immediately.
FCR has two flavors that are often confused. Daily FCR is calculated as feed consumption (kg) divided by egg mass (kg) on the same day, while cumulative FCR divides total feed since DOC by total egg mass up to today. Egg mass itself is the sum of eggs multiplied by average egg weight. A real example: 8,500 eggs with an average weight of 58 grams produce 493 kg egg mass; if 1,150 kg feed is used, then daily FCR = 1,150 / 493 = 2.33. Some farms use FCR per egg (1,150 / 8,500 = 0.135 kg per egg) because it is easier for supervisors to understand, but that number cannot be compared directly with breeder standards, which are always based on egg mass.
Hen-day production is calculated from eggs divided by the live population that day, multiplied by 100. Do not confuse it with hen-housed production, which divides by the initial population. Example: initial population 10,000 chickens, cumulative mortality 120 chickens so live population is 9,880; production of 8,900 eggs yields hen-day 90.1%, while hen-housed is only 89.0%. This 1.1-point difference looks small, but if used interchangeably between months, the performance trend becomes misleading. Rule of thumb: use the end-of-day population, after subtracting mortality and culling, and store both metrics so historical comparisons remain valid.
The quality of an automated report depends entirely on data granularity. At a minimum, the following must be stored per day per flock: the amount of feed that actually leaves the warehouse (kg), whole, cracked, and dirty eggs, total egg weight or a representative sample, initial population, mortality, and culling. Common field references for commercial layers: peak hen-day production 92–95% at 26–30 weeks of age, feed intake 105–115 grams per chicken per day, and cumulative FCR 2.0–2.2 up to 80 weeks of age. Without daily data, these benchmark numbers cannot be used to detect deviations early.
The most common mistakes I find when auditing poultry ERP systems: feed is recorded monthly, egg weight is only weighed from 30 eggs once a week, and population uses the beginning-of-month number. As a result, FCR spikes or drops falsely on certain days and managers lose trust in the report. The principle is simple — one daily fact table as the single source of truth, all reports are derived from it, not from manual recaps that differ by department.
The minimal schema I use in layer ERP implementations consists of four tables: flock (flock_id, tanggal_doc, populasi_awal, strain), daily_log (populasi, mati, afkir per day), feed_issue (kg per warehouse or house per date), and egg_harvest (number of eggs and weight kg). Store all weights in kilograms, do not mix grams and kg in the same column. The following PostgreSQL 16 view calculates both metrics at once, complete with zero-division handling via NULLIF and LEFT JOIN so that days without harvest still appear in the report.
CREATE VIEW v_daily_performance AS
SELECT d.flock_id, d.tanggal,
       h.populasi_awal - COALESCE(m.mati,0) AS populasi,
       COALESCE(f.feed_kg,0) AS feed_kg,
       COALESCE(e.butir,0) AS butir,
       COALESCE(e.berat_kg,0) AS egg_mass_kg,
       COALESCE(e.butir,0)::numeric / NULLIF(h.populasi_awal - COALESCE(m.mati,0),0) * 100 AS hen_day_pct,
       COALESCE(f.feed_kg,0) / NULLIF(e.berat_kg,0) AS fcr_harian
FROM daily_log d
LEFT JOIN (SELECT flock_id, tanggal, SUM(kg) feed_kg FROM feed_issue GROUP BY 1,2) f USING (flock_id, tanggal)
LEFT JOIN (SELECT flock_id, tanggal, SUM(jml_butir) butir, SUM(berat_kg) berat_kg FROM egg_harvest GROUP BY 1,2) e USING (flock_id, tanggal)
LEFT JOIN (SELECT flock_id, tanggal, SUM(ekor) mati FROM mortality GROUP BY 1,2) m USING (flock_id, tanggal)
JOIN flock_population h USING (flock_id, tanggal);
For cumulative FCR, use the window function SUM(feed_kg) OVER (PARTITION BY flock_id ORDER BY tanggal) divided by SUM(egg_mass_kg) OVER (PARTITION BY flock_id ORDER BY tanggal). Make sure there is a composite index on (flock_id, tanggal) in every fact table. On 200 thousand rows, this query finishes under 50 ms so it is safe to call directly from the dashboard without needing a materialized view.
Add guardrails at the database level, not only in the application. The constraint CHECK (berat_kg > 0 AND berat_kg < 5000) prevents unit-entry mistakes, a trigger can reject an egg count greater than population multiplied by 1.1 (an indication of double yolk or double entry), and automatically flag outliers when daily FCR falls outside the 1.5–3.0 range. This validation is what distinguishes a trusted automated report from a query that merely runs every night.
Once the view is ready, schedule the daily computation at 05:30 and 17:00 using node-cron in Node.js 20 LTS, or pg_cron if you want everything inside the database. Store the results in the report_daily table with ON CONFLICT (flock_id, tanggal) DO UPDATE so the process is idempotent — afternoon input corrections will automatically update the report, not create duplicates. A separate summary table also keeps the transaction table lightweight when the dashboard is accessed by dozens of users.
For distribution, render PDF with Puppeteer 22 then email it to the manager, or send a text summary to WhatsApp Business API and Telegram Bot. In the field, Telegram groups have proven fastest to adopt because foremen are already used to using them. For deeper analysis, connect Metabase to the same view so the team can drill down per house without writing SQL.
The most frequently forgotten part is alerting. Send automatic notifications if hen-day drops by more than 5 points for two consecutive days, if daily FCR exceeds 2.6, or if feed intake is below 95 grams per bird per day. With thresholds like these, feed quality or house ventilation problems can be detected within 24 hours, rather than waiting for a monthly report.
Use egg mass for management reports because it is the breeder standard and allows comparison between flocks with different egg weights. FCR per egg is still useful for daily communication with the house, but do not use it to evaluate feed efficiency between periods.
At least once a day for feed and egg harvest, because both determine daily FCR. Egg weight can use a sample of 30–60 eggs per house per day, as long as the sampling method is consistent. Weekly input will make alerts lose their function.
It can for a scale below 5,000 birds. Use Google Apps Script with a daily trigger and QUERY formulas to summarize, but as the number of houses and flocks grows, the 10 million cell limit and the difficulty of audit trails will become obstacles. Migration to PostgreSQL usually happens when the population exceeds 20,000 birds.
Store flock_id and kandang_id in every fact table, then use PARTITION BY flock_id in window functions. Farm-level reports only need to sum egg mass and feed across all houses, but hen-day must be calculated from total eggs divided by total population — not the average percentage per house, because that would be biased.
The automated FCR and hen-day production report is not a big project: four tables, one view, one cron job, and one notification channel are enough to turn scattered house data into daily decisions. The real value is not in the report, but in the speed at which you respond to deviations — a 0.1 point FCR difference detected today is far cheaper than one that only becomes visible at the end of the cycle. If you are building or tidying up a similar system for a layer farm, our team is ready to help from data schema design, high-performance queries, to WhatsApp integration and dashboards. Please contact Nugroho Setiawan for a short consultation session and mapping of your farm system needs.
Related solutions by PT Pilar Inovasi Informatika (Pilar Inovasi IT products): Agriculture ERP. Need a free consultation?
Belum ada komentar. Jadilah yang pertama!
Baca juga artikel lainnya