This article discusses strategies for implementing livestock ERP to accurately track production costs per barn. Learn about key modules, data integration, and in-depth analysis to achieve operational efficiency and increase your farm's profitability.
In the competitive livestock industry, profit margins are often very thin. Farmers face major challenges in managing various cost variables, from fluctuating feed prices, the cost of medicines and vaccines, to labor costs and operational overhead. Without an accurate and detailed cost tracking system per house, it is very difficult to identify areas of waste, evaluate the performance of each production unit, or make appropriate strategic decisions. Often, farmers only have a picture of total costs, which hides inefficiencies at the individual house level. For example, one house may perform poorly due to feed or health issues, but this is not clearly visible if the data is mixed with other well-performing houses. This situation hampers the optimization of FCR (Feed Conversion Ratio), improvement of average weight, and ultimately, profitability. This is where the role of livestock Enterprise Resource Planning (ERP) becomes crucial. An ERP system provides an integrated framework for managing all operational aspects, including the ability to precisely track production costs down to the house level. This article will guide you in depth on how livestock ERP can transform your cost management, from basic concepts to technical implementation, best practices, and answers to common questions, to ensure every decision you make is supported by valid and actionable data.
The importance of accuracy in tracking production costs in the livestock sector cannot be underestimated. Feed costs, for example, often dominate the operational cost structure, reaching 60-70% of total expenses. Meanwhile, the cost of medicines and vaccines can account for 10-15%, with the remainder allocated to the cost of seeds (DOC/DOD), labor, electricity, water, and asset depreciation. Without the ability to track and allocate these costs specifically per house, management will find it difficult to determine which production units generate optimal profits and which are actually a burden. This hampers effective strategic decision-making, such as setting competitive selling prices, evaluating the genetic performance of seeds, or early identification of health problems in certain livestock groups.
Livestock ERP, in this context, is an integrated software system specifically designed to meet the unique needs of the livestock industry. It is not merely a data recording tool, but a comprehensive platform that integrates various modules such as production management, inventory, finance, and human resources. For the purpose of tracking production costs per house, our main focus will be on the production and inventory modules, which are the backbone of real-time and accurate cost data collection in the field.
The main cost components that must be tracked in detail include: **Feed** (type, amount consumed, purchase price per batch); **Medicines and Vaccines** (type, application dose, purchase price, expiration date); **Seeds** (DOC, DOD, or other young livestock, purchase price per head); **Labor** (work hours allocated per house, wages); and **Overhead** (electricity, water, fuel, cleaning costs, depreciation of equipment and buildings). Each of these components needs to be recorded with relevant attributes so that it can be analyzed in depth. For example, feed must be recorded with batch number, expiration date, and supplier to facilitate tracing if quality problems occur.
Cost allocation methods are also an important consideration. Direct costs such as feed and medicines used specifically for a house are relatively easy to allocate. However, indirect costs or overhead, such as electricity costs for the entire farm area or general administrative staff salaries, require a consistent allocation method. Common methods include allocation based on house area, livestock population, or even the proportion of revenue generated by each house. Consistency in the allocation method is crucial for valid data comparison between periods and between houses.
As a concrete example, the "Maju Jaya" Broiler Chicken Farm has five houses with a capacity of 10,000 birds each. Before using ERP, they only knew the total monthly feed expenditure of Rp 350 million for the entire farm. With ERP, they can see that House A consumes 10 tons of feed worth Rp 70 million, House B 12 tons worth Rp 84 million, and so on. This data is then linked to population, mortality, and harvest weight data from each house. From this, managers can calculate FCR per house precisely, for example House A has an FCR of 1.55, while House B is 1.62. This difference triggers further investigation, allowing them to identify that House B has a ventilation problem that causes stress in the chickens and higher feed consumption per kilogram of body weight, so they can take specific corrective actions in House B.
An effective livestock ERP implementation for tracking production costs per house requires the integration of several key modules that interact with each other. The **Inventory Management Module** is responsible for tracking the stock of feed, medicines, and seeds in real time. Every purchase of raw materials will be recorded in this module, updating stock quantities and recording acquisition costs. When these raw materials are used for a specific house, the usage data will be recorded as output, reducing stock and allocating costs to that house. Features such as batch tracking for feed and medicines (including expiration dates, suppliers, and lot numbers) are essential to ensure quality and food safety.
Next, the **Production Management Module** is the core of data collection in the field. This module allows the recording of daily or periodic details such as initial population, mortality, feed consumption, administration of medicines and vaccines, average livestock weight, and other performance metrics such as FCR and Performance Index (IP) per house. These data are input by house staff through a user-friendly interface, often using mobile devices or tablets that are directly integrated with the ERP system. The accuracy of data in this module greatly determines the quality of cost analysis.
Finally, the **Financial Management Module** functions as an aggregator of all cost and revenue data. This module receives cost inputs from the inventory and production modules, and records all other operational transactions. With strong integration, the financial module can produce income statements per house, production cost reports per kilogram or per head, and in-depth profitability analysis. Integration with other modules ensures that all cost data is recorded automatically and accurately, reducing the risk of manual errors.
From a system architecture perspective, modern livestock ERPs are generally built as web-based applications with a microservices or modular monolithic approach. For the backend, frameworks such as **Laravel 11.x** (PHP) or **Node.js 20 LTS** (with Express.js or NestJS) are very popular due to their scalability and strong developer ecosystem. As a database, **PostgreSQL 16** or MySQL 8.x is often the choice due to its reliability and ability to handle large data volumes. The frontend is usually developed using JavaScript libraries such as **React 18.x** or Vue 3.x, which offer a responsive and interactive user experience. Communication between modules and with external systems (for example, IoT devices or accounting systems) is done through RESTful APIs with JSON as the data format.
The data flow in an integrated ERP system runs as follows: The purchase of feed or medicine is recorded in the Inventory module, increasing stock and recording acquisition costs. When feed or medicine is used for House X, the usage transaction is recorded in the Production module, automatically reducing stock in Inventory and allocating costs to House X. Daily production data (mortality, weight, etc.) is also recorded in the Production module. All of this data is then fed into the Financial module to compile cost reports per house. In addition, other important features may include IoT integration with temperature, humidity, or automatic feed scale sensors to reduce manual input and improve data accuracy. Mobile applications for field data entry are also a standard feature for operational efficiency.
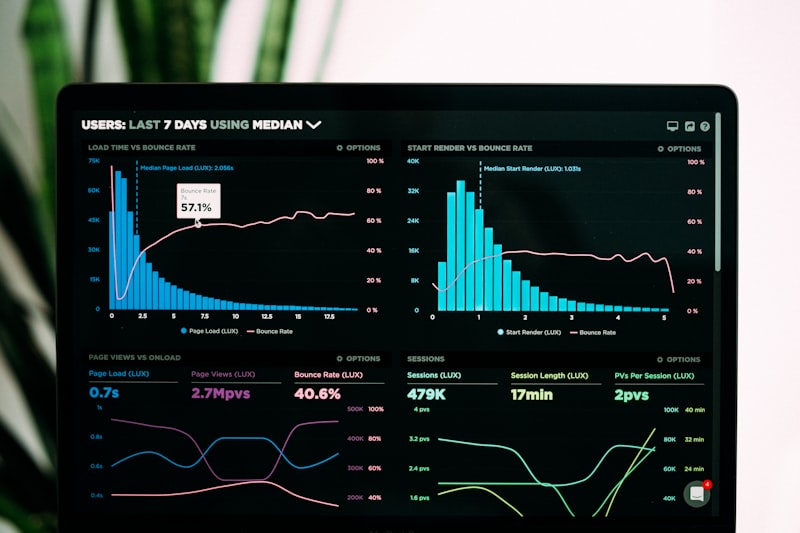
As an implementation example, a large-scale layer farm adopts a custom ERP based on Laravel 11.x with a PostgreSQL 16 database. Every morning, house staff use tablets to input data on feed consumption, egg count, and mortality in each house. This data instantly enters the system, updates feed inventory records, calculates daily feed costs per house, and updates production metrics. Operations managers can access a real-time dashboard that displays daily FCR, cost per kilogram of eggs, and profit projections per house. This system is also integrated with automatic feed scale sensors that verify manual input, reducing the potential for errors by up to 90% and providing full visibility into the performance of each production unit accurately.
To support effective tracking of production costs per house in a livestock ERP, a well-defined database structure is fundamental. We need core tables to store information about houses, products (feed, medicines, seeds), inventory transactions that record product movements, and daily production records per house. The relationships between these tables are crucial to ensure data integrity and the ability to perform complex cost analysis. The `kandang` table will store the master data for each production unit. The `produk` table will contain details of all items used in production, such as types of feed, medicines, and seeds, along with their unit prices. The `transaksi_inventori` table will serve as the bridge between products and houses, recording every use of a product by a specific house, complete with quantity and total cost. Meanwhile, the `catatan_produksi_kandang` table will record daily operational metrics such as population, mortality, and feed consumption.
Relations between tables will be built in such a way that `transaksi_inventori` has a foreign key to `produk` and `kandang`, indicating which product is used by which kandang. Likewise, `catatan_produksi_kandang` will have a foreign key to `kandang`, linking daily performance data with the relevant production unit. This structure allows us to gather all the information needed to calculate production costs per kandang with precision, because every inventory expense can be attributed directly to the kandang that uses it. With a well-designed database, we can run complex queries to gain deep insights into the operational efficiency and profitability of each kandang.
-- Tabel Kandang untuk menyimpan informasi dasar setiap unit produksi.id SERIAL PRIMARY KEY,nama VARCHAR(100) NOT NULL,lokasi VARCHAR(255),kapasitas INT,tanggal_mulai DATE);-- Tabel Produk untuk menyimpan detail pakan, obat, dan bibit.CREATE TABLE produk (id SERIAL PRIMARY KEY,nama VARCHAR(255) NOT NULL,satuan VARCHAR(50) NOT NULL, -- misal: KG, LITER, EKORharga_satuan DECIMAL(18, 2) NOT NULL,tipe VARCHAR(50) NOT NULL -- misal: PAKAN, OBAT, BIBIT);-- Tabel Transaksi Inventori untuk mencatat penggunaan produk per kandang.CREATE TABLE transaksi_inventori (id SERIAL PRIMARY KEY,tanggal DATE NOT NULL,produk_id INT NOT NULL REFERENCES produk(id),kandang_id INT NOT NULL REFERENCES kandang(id),jumlah DECIMAL(18, 2) NOT NULL,tipe_transaksi VARCHAR(50) NOT NULL, -- misal: PENGGUNAAN, PEMBELIANbiaya_total DECIMAL(18, 2) NOT NULL -- Harga_satuan * Jumlah);-- Tabel Catatan Produksi Kandang untuk menyimpan data performa harian.CREATE TABLE catatan_produksi_kandang (id SERIAL PRIMARY KEY,tanggal DATE NOT NULL,kandang_id INT NOT NULL REFERENCES kandang(id),populasi_awal INT NOT NULL,mortalitas INT NOT NULL DEFAULT 0,populasi_akhir INT NOT NULL,konsumsi_pakan_kg DECIMAL(18, 2) NOT NULL,berat_rata_rata_kg DECIMAL(18, 2),keterangan TEXT);The SQL code above defines a basic database schema using PostgreSQL 16. The `kandang` table stores the identity and basic attributes of the kandang. The `produk` table records the types of items used in production, along with their unit prices. The `transaksi_inventori` table is the key to cost tracking, because each row records when, what product, how much, and for which kandang an item was used, while also calculating `biaya_total` based on the `harga_satuan` from the `produk` table. The `catatan_produksi_kandang` table completes the data by recording daily operational metrics such as population, mortality, and feed consumption. With this structure, we can easily link inventory costs with the production performance of each kandang, enabling cost analysis per kilogram of production or per head.
<?phpnamespace App\Http\Controllers;use Illuminate\Http\Request;use Illuminate\Support\Facades\DB;use App\Models\Kandang;class BiayaKandangController extends Controller{ public function getBiayaPakanPerKandang(Request $request) { $request->validate([ 'tanggal_mulai' => 'required|date', 'tanggal_akhir' => 'required|date|after_or_equal:tanggal_mulai', ]); $tanggalMulai = $request->input('tanggal_mulai'); $tanggalAkhir = $request->input('tanggal_akhir'); $biayaPakan = DB::table('transaksi_inventori AS ti') ->join('produk AS p', 'ti.produk_id', '=', 'p.id') ->join('kandang AS k', 'ti.kandang_id', '=', 'k.id') ->select( 'k.nama AS nama_kandang', DB::raw('SUM(ti.biaya_total) AS total_biaya_pakan') ) ->where('ti.tipe_transaksi', 'PENGGUNAAN') ->where('p.tipe', 'PAKAN') ->whereBetween('ti.tanggal', [$tanggalMulai, $tanggalAkhir]) ->groupBy('k.nama') ->orderBy('k.nama') ->get(); return response()->json([ 'status' => 'success', 'data' => $biayaPakan ]); }}The PHP code above is a simple example of a controller in the Laravel 11.x framework that functions to calculate the total feed cost used per kandang within a certain date range. The `getBiayaPakanPerKandang` function receives `tanggal_mulai` and `tanggal_akhir` as parameters from the request. Then, it performs input validation to ensure the given dates are valid. Next, a database query is executed using the Laravel Query Builder, performing a JOIN between the `transaksi_inventori`, `produk`, and `kandang` tables. This query specifically filters transactions of type 'PENGGUNAAN' and products of type 'PAKAN' within the specified date range. The result is a list of kandang names along with the total feed cost they have consumed during that period. This is the basis of per-kandang cost analysis that can be extended to include medicine, seed, and overhead allocation costs, giving managers a clear view of the operational expenses of each production unit.
In a modern livestock ERP ecosystem, data integration is the key to comprehensive operational visibility. An ERP system does not stand alone; it often needs to interact with various external systems. This can include IoT devices that monitor kandang conditions (temperature, humidity, feed levels), external accounting systems for financial reporting, or even data platforms from feed suppliers to compare prices and quality. The most commonly used integration standard today is RESTful API with JSON data format. This approach enables flexible, lightweight, and easy-to-implement data exchange between different systems, regardless of the programming language or platform used.
For example, IoT devices in the coop or mobile applications used by field staff will send feed usage data and daily production records to the ERP via API. The following is an example of a realistic JSON payload for recording feed usage and daily production data:
{ "kandang_id": 101, "tanggal_transaksi": "2023-10-26", "data_penggunaan": [ { "produk_id": 1, "jumlah_digunakan": 250.75, "satuan": "KG", "tipe_produk": "PAKAN" }, { "produk_id": 5, "jumlah_digunakan": 1.5, "satuan": "LITER", "tipe_produk": "OBAT" } ], "catatan_produksi": { "populasi_awal": 5000, "mortalitas": 15, "berat_rata_rata_kg": 1.85, "keterangan": "Pemberian pakan tahap grower dan vaksinasi ND-IB." }}The JSON payload above represents inventory usage data (feed and medicine) as well as production record data (population, mortality, average weight) for `kandang_id` 101 on October 26, 2023. The API endpoint on the ERP side must be designed to receive this payload, perform validation, and then process it to update stock in the inventory module, record cost transactions in the `transaksi_inventori` table, and update daily production records in the `catatan_produksi_kandang` table. A good API design must consider idempotency and transaction mechanisms to ensure data consistency.
Error handling is a crucial aspect of any integrated system. Failures can occur for various reasons: invalid input data, network connection issues, database errors, or authentication problems. The system must be able to respond to errors in an informative and actionable manner. The following is an example of a structured error message:
{ "status": "error", "code": 422, "message": "Validasi gagal: Jumlah_digunakan untuk produk_id 1 tidak boleh negatif.", "errors": { "data_penggunaan.0.jumlah_digunakan": [ "Jumlah penggunaan tidak valid. Harus lebih besar dari 0." ] }}This error message clearly indicates that there is a validation problem with the `jumlah_digunakan` input for the first product in the `data_penggunaan` array. To handle such errors, several important strategies must be implemented: First, strict **Input Validation** on the server side (backend) and ideally also on the client side (frontend/mobile application). Ensure all incoming data complies with business rules (for example, quantities cannot be negative, product IDs must exist). Second, comprehensive **Logging**. Record all errors in detail, including stack traces, request payloads, and timestamps, into a centralized logging system (for example, using Sentry, ELK Stack, or Grafana Loki). This is very helpful in the debugging process and root cause analysis. Third, **Graceful Degradation**. If one part of the integration fails, ensure the core system continues to function. For example, if data from IoT sensors does not come in, manual input can still be performed. Fourth, **Automated Alerting**. Configure the system to send automatic notifications (email, Slack, Telegram) to administrators or the IT team if critical errors or persistent integration failures occur. Fifth, **Retry Mechanism**. For integrations with external services that may experience temporary failures, implement a retry mechanism with exponential backoff. This will retry sending data after increasingly longer delays, giving the external service a chance to recover.
Define a Clear and Detailed Cost Structure: Before starting ERP implementation, it is very important to have an in-depth and well-defined understanding of all relevant cost categories in your livestock operations. This includes direct costs such as feed, medicines, and seeds, as well as indirect costs or overhead such as electricity, water, asset depreciation, and general staff salaries. Each cost component must have a consistent and logical allocation method to each coop, ensuring that the resulting cost reports are accurate and reliable for in-depth analysis.
Ensure Master Data is Accurate and Standardized: The foundation of any successful ERP system is clean and consistent master data. Ensure all master data such as the list of coops, types of feed, medicines, and seeds have unique codes, clear descriptions, and relevant attributes. Perform data cleansing processes regularly and establish standard procedures for adding or changing master data. Inconsistent master data will produce misleading cost reports and invalid analysis.
Conduct Comprehensive and Ongoing User Training: Field staff, including coop and warehouse officers, are the primary data sources for the ERP. Therefore, investing in comprehensive and ongoing training for them is crucial. Ensure they understand the importance of data accuracy and how to input information correctly into the system. Data input errors at the initial point can have a major impact on overall data integrity and the accuracy of cost reports.
Prioritize Automation and IoT Integration: Leverage technology to reduce manual involvement in data collection. Integrate IoT devices such as automatic feed sensors, digital scales, or coop environmental sensors (temperature, humidity) directly into your ERP system. This automation not only improves data accuracy by minimizing human error but also frees up staff to focus on more strategic tasks, while providing real-time data for quick decision-making.
Implement Real-time Data Validation and Periodic Audits: To maintain data quality, the ERP system must apply data validation at every input point. For example, the system should automatically reject feed usage inputs that exceed available stock or record unreasonable dates. Additionally, conduct periodic data audits, comparing digital records with physical inventory or field records, to identify and correct inconsistencies before they impact cost analysis.
Provide Flexible and Customizable Reports and Dashboards: Managers and decision-makers need easy access to relevant cost information. The ERP system should provide interactive dashboards and customizable reports, allowing users to view costs per coop, per time period, per product type, and other performance metrics. The ability to drill down from summary reports to transaction details is essential for in-depth investigation and evidence-based decision-making.
Ensure Scalability and Robust System Security: Choose an ERP architecture that can scale with your farm's growth, both in the number of coops and production volume. Consider cloud-native solutions or modular designs that allow adding features or capacity without overhauling the entire system. Additionally, protect your farm's sensitive data with encryption, strict role-based access control (RBAC), and routine data backup procedures to prevent loss or leakage of information. Ensure the ERP system complies with current data security standards and applicable industry regulations.
What is the main advantage of tracking costs per coop compared to total farm costs?Tracking costs per coop provides much more granular and actionable insights into operational efficiency and profitability. With per-coop data, you can identify which production units are performing best or worst, find the root causes of performance differences (e.g., feed issues, livestock health, or specific management), and take targeted corrective actions. This enables optimization of resource allocation, process improvement, and increased profitability that would be impossible to achieve by only looking at total farm costs as a whole.
How complex is the implementation of a farm ERP for cost tracking?The complexity of ERP implementation varies greatly depending on your farm's scale, the number of coops, and the level of customization and integration desired. For small farms with basic needs, implementation can be relatively simple with off-the-shelf solutions. However, for large farms with many coops, integration with IoT devices, and in-depth custom reporting needs, implementation can take months and require significant investment in development, training, and business process changes. Careful planning and selecting the right vendor are key to success.
How do I allocate overhead costs such as electricity or general staff salaries to each coop?There are several common methods for allocating overhead costs. You can allocate them based on the average livestock population per coop, the coop's area, or even the proportion of revenue generated by each coop. The choice of method must be consistent and well-documented in your accounting policies. For example, electricity costs can be allocated based on the number of chickens in each coop, while the depreciation cost of coop buildings can be allocated based on the area of each coop. This consistency ensures fair and comparable cost reports.
Can a farm ERP integrate with the company's existing accounting system?Yes, most modern farm ERP systems are designed with integration capabilities. Integration with external accounting systems is usually done through an API (Application Programming Interface), which allows automatic and real-time data exchange. Cost transaction data from the inventory and production modules in the farm ERP can be automatically synchronized to your accounting system, such as Jurnal.id or Accurate Online, for comprehensive financial reporting, bank reconciliation, and audit processes without the need for manual double data entry.
What are the key metrics I should monitor after ERP implementation?After ERP implementation, several key metrics you should routinely monitor include Feed Conversion Ratio (FCR) per coop, feed cost per kilogram of production, daily and cumulative mortality, average weight per bird, Performance Index (IP) or European Production Efficiency Factor (EPEF), and of course, gross profit and loss per coop. Regularly monitoring these metrics will provide a clear picture of operational efficiency, livestock health, and the profitability of each production unit, enabling you to make data-driven decisions for continuous improvement.
How do you ensure that data entered by field staff is accurate?Ensuring the accuracy of data from field staff requires a combination of strategies. First, design an intuitive and easy-to-use input interface on mobile or tablet applications. Second, implement real-time input validation in the system to prevent common errors such as negative values or inputs outside a reasonable range. Third, provide repeated and ongoing training to staff, and provide incentives for accurate data entry. Fourth, leverage IoT technology to automate data input as much as possible, such as automatic feed scales, to minimize human intervention. Finally, conduct regular data audits and cross-comparisons with physical records to identify and correct discrepancies.
Implementing a livestock ERP for tracking production costs per barn is not merely a technological upgrade, but a crucial strategic transformation. With the ability to turn raw data into actionable insights, farms can identify hidden efficiency opportunities, optimize resource use, and ultimately, significantly increase profitability. This is no longer a luxury, but a competitive necessity in a livestock market that increasingly demands efficiency and accuracy. An integrated ERP system allows you to make faster and smarter decisions, reduce risk, and ensure sustainable business growth. If you are an operations manager, farm owner, or IT Manager looking for innovative technology solutions to optimize cost management on your farm, do not hesitate to contact Nugroho Setiawan. With extensive experience in developing Poultry/Layer ERP, SIMRS, and various other digital solutions, we are ready to help you design and implement a livestock ERP system that suits your specific needs. Visit our website or contact us directly for a free consultation and product demonstration that can provide real added value to your operations.
Related solutions by PT Pilar Inovasi Informatika (Pilar Inovasi IT products): Agriculture ERP SIMRS (Hospital Information System). Need a free consultation?
Belum ada komentar. Jadilah yang pertama!
Baca juga artikel lainnya